Every successful SEO campaign must begin with comprehensive research. From analyzing initial domain benchmarks to conducting an in-depth investigation, you must make sure that your data is accurate and complete from the start.
When performing your analysis, ask yourself a set of key questions:
- How is your site currently doing?
- What keywords are you ranking for, and what keywords are your competitors ranking for?
- How many backlinks does your site currently have?
- How many backlinks do your competitors have?
- Does your site have any technical errors?
To answer those questions, you can use SEMrush to establish a benchmark of where you stand and accurately evaluate your progress over time. Best of all, you’ll be able to do so in just a few simple steps:
Create a Domain Overview Report
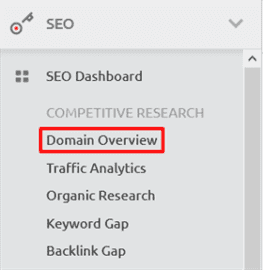
SEMrush’s Domain Overview feature displays a range of metrics about any site’s online presence and visibility. You’ll find it under competitive research in the SEO section:
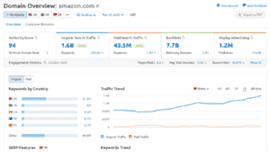
Click it and you’ll be presented with an easy-to-read report for the URL of your choice complete with color-coded charts and graphs. We’ll use reports for Amazon’s U.S. homepage as an example:
The report’s data points include:
- a site authority score;
- organic search traffic;
- paid search traffic;
- backlinks, including referring domains;
- keywords by country; and
- various engagement metrics.
From the report’s main page, you can click any metric to instantly access more detailed information.
Perform Organic Research
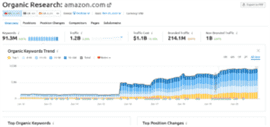
SEMrush’s Organic Research reports display detailed information about a site’s traffic, top organic search competitors and organic keyword performance.
You’ll find the Organic Research section under competitive research within the SEO menu. Click it and enter the domain you want to perform organic research on:
You should add these metrics to a key performance indicator (KPI) tracking spreadsheet to set up your benchmarks.
Pay close attention to the numbers under Keywords, Traffic, Traffic Cost, Branded Traffic and Non-Branded Traffic. These are valuable metrics to track as your campaign progresses. Here’s what they mean:
- Keywords: The number of keywords your site ranking for in the top 100.
- Traffic: Estimated traffic based on the number of keywords ranking, their position, and the estimated search volume.
- Traffic cost: The amount you’d have to pay Google Adwords to gain the visibility that you have organically. This number increases as you rank for keywords that are more transactional and lower in the funnel. The higher people are willing to bid for those keywords, the higher the value. This is a great metric to make sure the site is not just targeting keywords that have no transactional value, and can help anchor a monetary value to your organic SEO campaign.
- Branded Traffic: Keywords that include your brand name. This is influenced by brand awareness, social media campaigns and traditional advertising methods.
- Non-Branded Traffic: keywords that do not include your brand name.
Next, you can modify specific graphs to display the exact data you’re after.
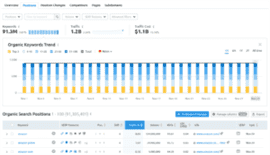
In the Organic Keywords Trend box, you can use the checkboxes to choose the number of organic keywords you want to view:
This will help you see if your organic traffic and keywords are trending up or down and if they’re changing over time.
You can also click on Traffic to see the Estimated Traffic Trend graph:
Notice that you can change the date range of the time to see “all time”, two years, one year, six months or one month. By viewing your estimated traffic trend for different timeframes, you can achieve a deeper understanding of your site’s current and past health.
You will also get a snapshot of the top organic keywords based on volume, as well as the keywords that have had the greatest change in ranking positions:
Just below the Top Organic Keywords and Top Position Changes boxes, you’ll see an overview of SERP performance titled SERP Features. This section summarizes the different types of search results that pages from this domain appear in:
From the image, you can see that SERP results linking to the domain include 205.7 keywords from featured snippets, 18.4M from reviews, 433.4K from images and so on.
As you scroll down you’ll find the next sections, Top Pages and Top Subdomains. These sections tell us, at a glance, which pages have the most volume both in terms of traffic and in terms of keywords ranking.
You can use them to isolate the top performers as pages with the most visibility and the highest value:
Finally, you will see a breakdown of your top competitors and a map for how they stack up against you (and each other):
By the end of this report, you will have a strong overview of how the site is performing, what the top pages are, what the top keywords are and who you’re competing with.
Explore Your Organic Metrics
At the top of your Organic Research report, there are five other tabs that you can take a look at to get more in-depth information on your domain. They include:
-
- Positions;
- Position Changes;
- Competitors;
- Pages; and
- Subdomains.
Let’s take a closer look at each.
Positions
When you click on the Positions tab, you will see the following screen:
This section lets you dig into your keyword rankings to find out how many of them rank for specific positions.
You can also export your keyword ranking report into a spreadsheet that will tell you metrics like each keyword’s position, previous position, traffic percentage, competition and number of results:
Position Changes
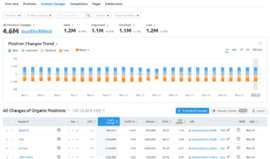
Next, move on to the Position Changes tab. When you click on it, you should see the following:
If you briefly scan the overview of the Position Changes report, you will see the following headings:
- All Position Changes: This shows the total number of keyword changes that have occurred for the analyzed domain.
- New: This is the total number of new keywords that are actually ranking.
- Improved: This shows the number of keywords for which an analyzed domain has improved its ranking in the SERPs.
- Declined: This shows the number of keywords which have declined in performance.
- Lost: This one shows the number of keywords for which an analyzed domain has lost its position in the SERPs entirely.
You can also download and export a spreadsheet or PDF of these results to put together in a nice visual report Your format choices include the usual: Excel, CSV or CSV semicolon.
Competitors
Now, let’s go ahead and click on the next tab up top, Competitors. Here, you’ll see a detailed overview of the competitors of the domain you entered here.
For our site example, you will see that Amazon’s top competitors include eBay, Pinterest and Walmart:
This tab’s Organic Competitors section features several additional metrics you can use in your reporting, too. These include:
- Keywords: The number of keywords bringing a user in from the search results.
- Traffic: An estimated traffic number prediction. Basically, it says that you can expect to see traffic of this amount if your organic traffic continues to stay the same.
- Cost: this is the overall monthly cost it would take to rank for each site’s organic keywords in Google AdWords.
This list of competitors and their corresponding data points can also be exported to a spreadsheet. Pro tip: As you continue to save and export these reports, be sure to store them in the same folder. It will make things much easier when it comes to compiling these reports in their own spreadsheet deliverables.
Pages
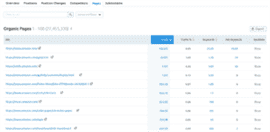
Next, let’s click on the tab up top labeled Pages. This one will allow you to view and export all of your site’s URLs:
You’ll also see specific metrics such as:
- URL: The page the metrics are being compiled for.
- Traffic: The amount of estimated organic traffic being driven to an analyzed page.
- Traffic %: The percentage of traffic being driven to the page.
- Keywords: The number of keywords that a given URL is ranking for in the top 100 Google search results.
- Ads keywords: The number of keywords that are bringing users in via the paid ads being published in the Google SERPs.
- Backlinks: The total number of backlinks pointing to a particular URL.
Subdomains
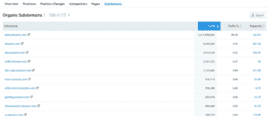
Finally, click on the Subdomains tab to view a chart like the following:
The information provided in tab is useful for making strategy decisions based on subdomain removal (if desired), 301 redirect removal (if needed) and other factors that may be weighing down the domain.
Dig into Your Data to Make Better Decisions Tomorrow
Practicing effectual SEO isn’t just about implementing best practices or following rules set by experts: It’s also about using the data at your disposal to make informed decisions that are custom-tailored to suit your site and its individual needs.
With the benchmarking and research tools available in SEMrush, you can easily access, understand and save the data you need to make those decisions and achieve the best rankings possible.
Image credits
Screenshots by iloveseo.com / November 2020

